

8·
58 minutes agoGives you a nice dashboard that you can configure however you like. It includes integration with a ton of existing services, as well as docker.
My setup:
Clicking on each service will open it’s respective url.
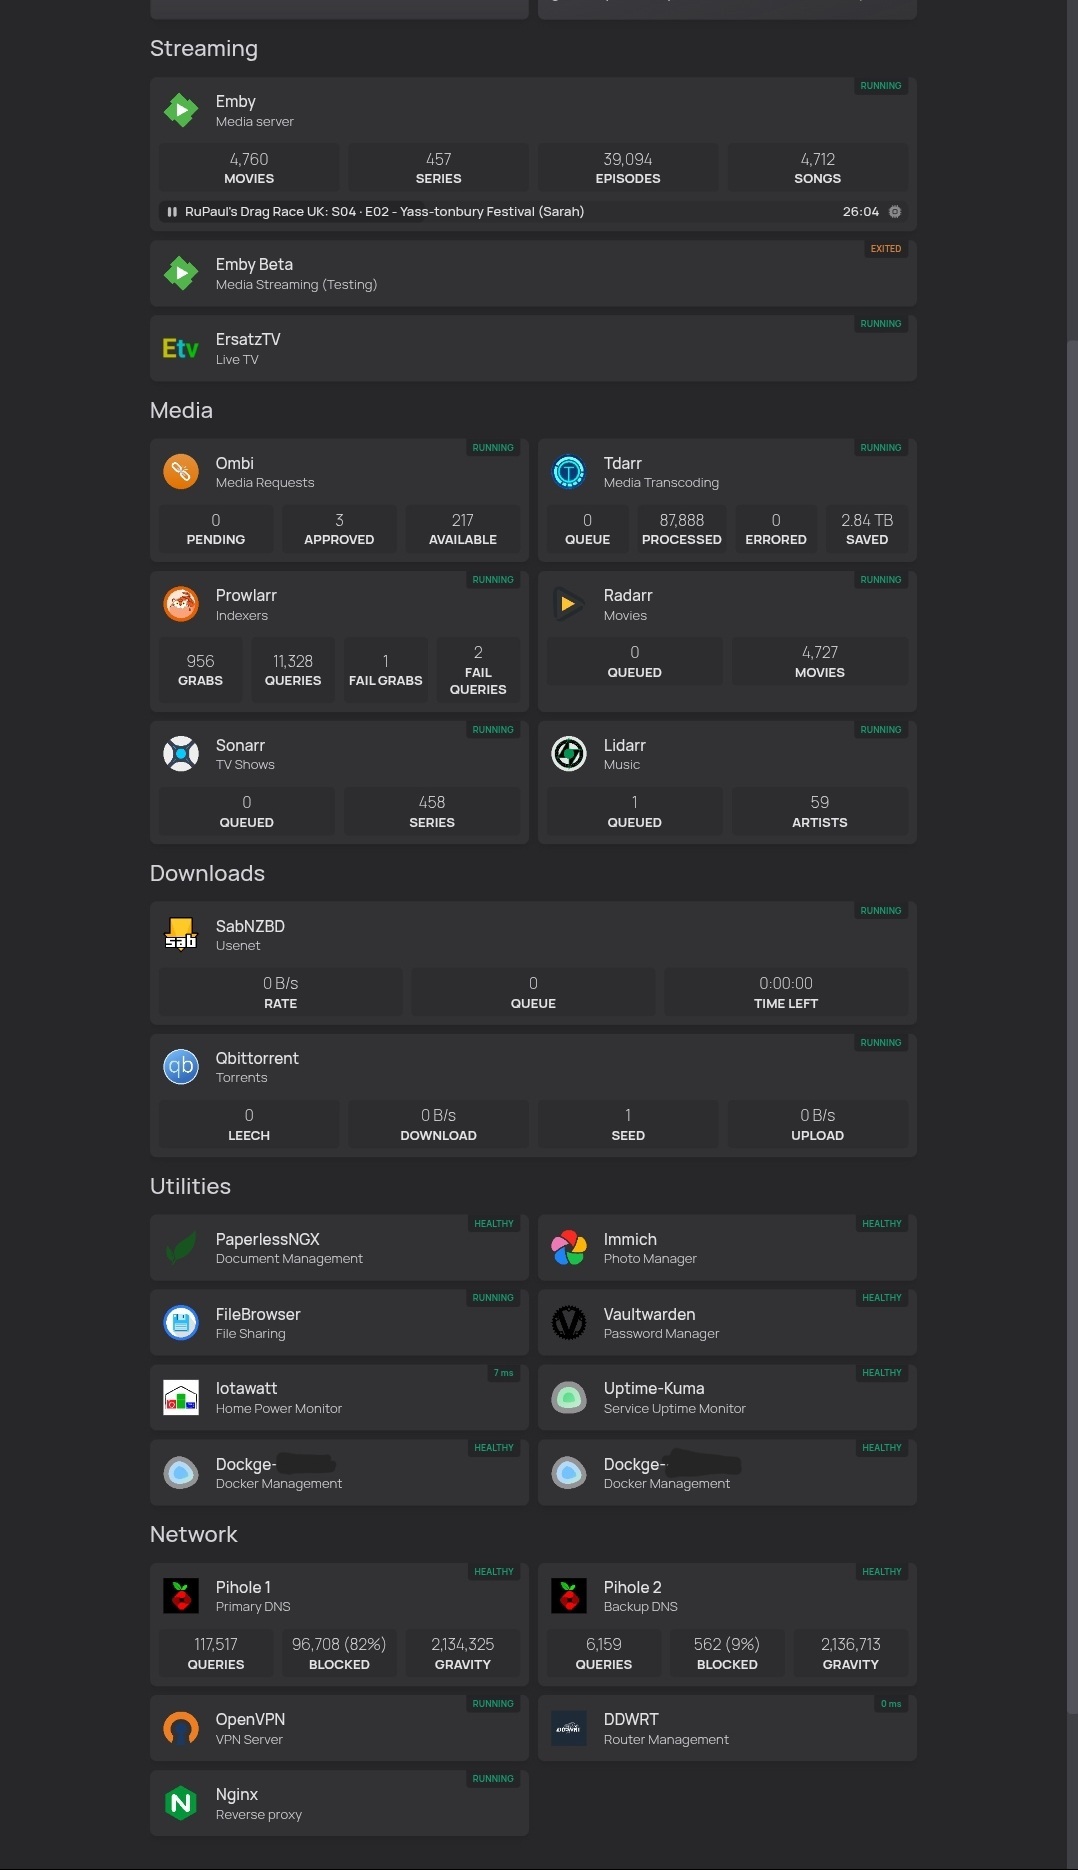
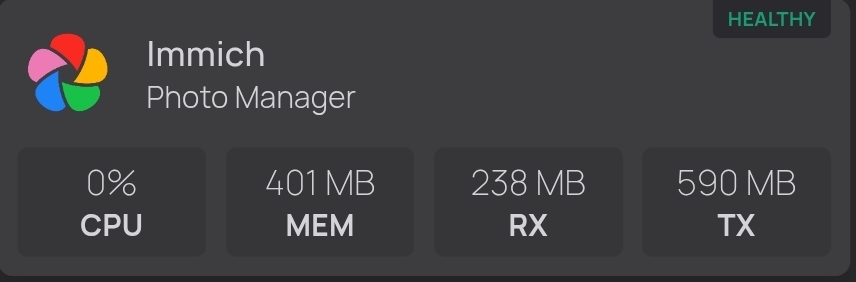
The ‘healthy’ indicator at the top right of each service is it’s container health. Clicking on that will expand to show cpu, ram and network usage. Some of these services/docker hosts are on separate machines; it all integrates together nicely.


I used to feel much the same way. I had a pile of bookmarks and a couple permanent browser tab groups.
That changed when I tried out Homepage
On top of just putting all the links in one place; it was really nice to combine a bunch of information from each service to view in one place.
Now I can look at a single page and see with a quick glance; what+how many items are queued in Radarr/Sonarr/Lidarr, what’s queued or errored in Tdarr, item count/time/speed in SabNZBD/Qbit, who’s streaming what in Emby, and even CPU/RAM usage across multiple systems. (not pictured)
I’d recommend exploring it, I didn’t think something like this was worth it until I actually tried it myself.